TICS Client Configuration Dialog
For the TICS client, the option exists to have the configuration done via a graphical user interface rather than passing extra options on the command line. This graphical user interface is reachable via multiple ways:
- It can be opened in a command-line window by the command
TICSConfig. - If in Windows, you can open it via the Start Menu in
TIOBE => TICS Client Configuration. - If working from an IDE with TICS, there should be a toolbar icon
TICS Rule and Options Configurationin the IDE that opens it.
Note that TICSConfig will store settings persistently on disk.
- Windows:
%APPDATA%/TICS - Linux:
~/.tics
This should then show the following dialog:
The Rulestab: specify which violations to show.
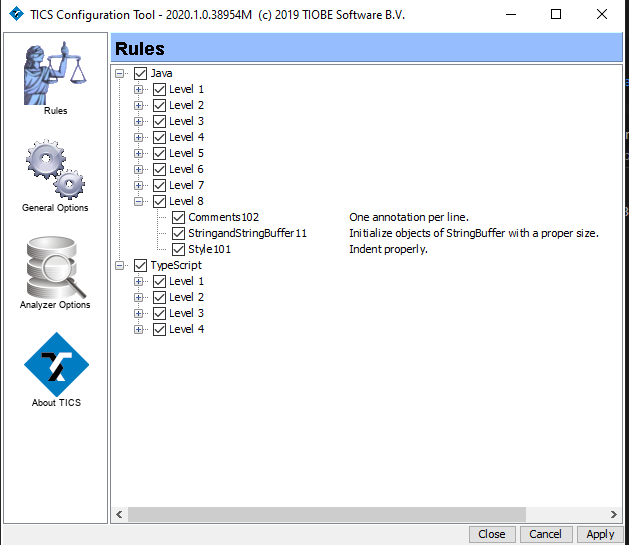
The rules are categorized by language and by level. Rules can be switched on and off per level or individually. If a rule has been switched off it is not shown anymore in the output window. Note that hidden violations are still detected and being used for statistical overviews. You can right-click on a rule for its documentation. The settings specified by the user are saved in the HIDDEN.txt file.
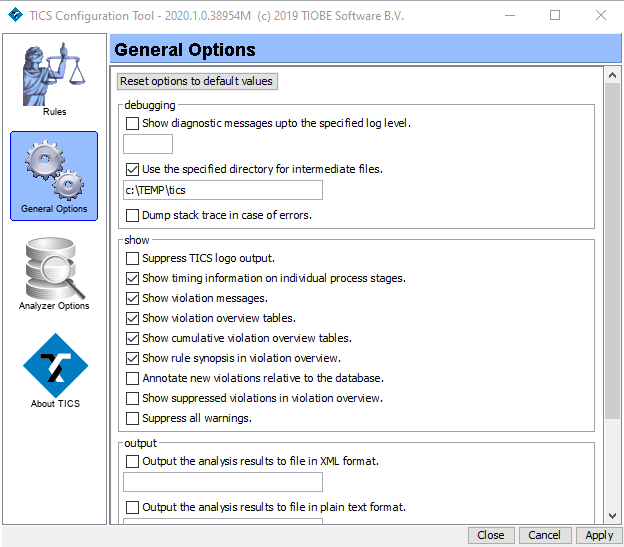
The tab General Optionsprovides general TICS options.
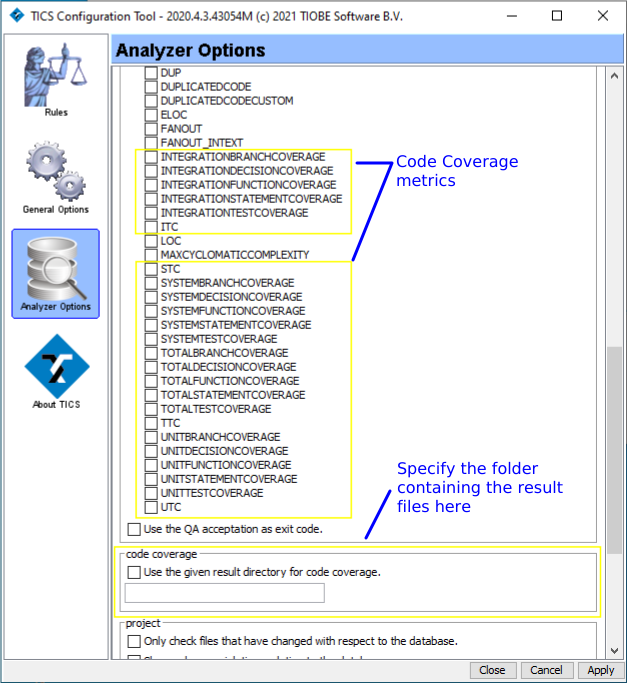
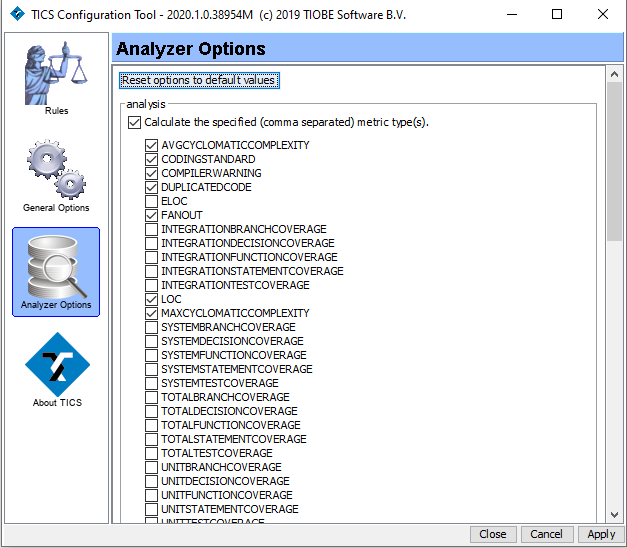
The tab Analyzer Optionsprovides options for the TICS analyzer.
Also in the Analyzer Optionstab, one can specify the location of Code Coverage result files (in case one of the Code Coverage metrics is enabled).