Metrics Explained
This page is intended to give an overview for the various metrics that can be measured by TICS. Note that this is not an exhaustive list of all intricacies that are part of the definitions of metrics. Instead, this is a broad overview of how the metrics are defined and which details are relevant when interpreting their values.
Code Coverage
Code coverage is a metric of test suite quality. Intuitively, it is the percentage of code that is covered by (automated) unit tests. These tests can automatically invoke parts of the software and evaluate whether their results are correct. Since automatic tests are much more reliable and cheaper to perform than manual tests, this enables software developers to test their code often, which could help to maintain high-quality software. Code coverage is a metric that can be evaluated on a low level (a single file or method), but it is usually computed over an entire project.
Statement Coverage
There are different types of coverage, which vary in terms of granularity and precision. The simplest form of code coverage is statement coverage (also known as line coverage). This is a metric for the percentage of statements that are executed by a unit test.
Consider the following example:
int foo(int a, int b) {
    int c = b;

    if (a > 3 && b > 0) {
        c = a;
    }

    return c * a;
}
This is an example of a method that can be tested using unit tests. A unit
tests consists of an input (such as foo(0,0) or
foo(4,2)) and an expected result for each test case (0 and 16
respectively for the given examples). This program has a total of 4 statements
(two assignments, an if statement and a return
statement). The test case foo(0,0) covers 3 of these statements
(75% coverage), while the test case foo(4,2) covers all statements
(100% coverage).
Branch Coverage
While statement coverage can give an indication of the quality of a test suite,
it may be too easy to achieve. For example, if we only use the second test, we
achieve a perfect coverage of 100%. However, it could be that for cases where
the condition of the if statement evaluates to false, the result
is incorrect. The notion of branch coverage alleviates this issue.
It requires every branch of every conditional or loop (including
if, case, while, and for
statements) to be tested at least once. This means that to achieve 100%
branch coverage, we need a test for which
a > 3 and b > 0 and one for which a ≤ 3 or b ≤ 0.
The previously presented examples are an example of a test suite
with 100% branch coverage for this method.
Decision Coverage
As branches get more complex, branch coverage may be insufficient as a metric as well. After all, we only have one test case for each branch. Since a conditional may be composed of an arbitrary number of boolean variables through conjunctions and disjunctions, there are many paths through the code that can end up untested even when 100% branch coverage is achieved. A third type of coverage, decision coverage, requires a test case for each of the composed conditions. That means that in our example, we need at least a case for a > 3 and a ≤ 3 as well as cases for b > 0 and b ≤ 0. Again, the provided test cases satisfy this.
Function Coverage
Finally, some tools measure function coverage. This is a very simple metric that determines the proportion of functions (or methods) that have been invoked by test cases. This type of coverage is too lenient to serve as a serious indicator of quality, but may be used to identify parts of the code that are not tested at all.
Code Coverage Tool Comparison
The type(s) of coverage that are taken into account by TICS depends on the tool that is being used to compute code coverage. The value that is used for the TQI is the average of the available coverage metrics. The only exception to this is function coverage, which is always excluded. The table below provides an overview of the coverage metrics that are supported by a variety of tools.
| Tool | Statement | Branch | Decision | Function | Report Format |
|---|---|---|---|---|---|
| BullseyeCoverage | ✔ | ✔ | Bullseye XML | ||
| Cobertura | ✔ | ✔ | Cobertura XML | ||
| dotCover | ✔ | dotCover XML | |||
| gcov/lcov | ✔ | ✔ | ✔ | lcov HTML | |
| Istanbul | ✔ | ✔ | Cobertura XML | ||
| Jacoco | ✔ | ✔ | ✔ | Jacoco XML | |
| LLVM | ✔ | LLVM (text) | |||
| MSBuild | ✔ | ✔ | MSBuild XML | ||
| NCover | ✔ | ✔ | NCover HTML | ||
| NCover (Open Source) | ✔ | NCover XML | |||
| OpenCover | ✔ | ✔ | ReportGenerator → Cobertura XML | ||
| Pycover | ✔ | Cobertura XML | |||
| Report Generator | ✔ | ✔ | Cobertura XML |
TQI Code Coverage
The TQI Code Coverage sub-metric [2] is defined as follows:
score = min(0.75 * test_coverage + 32.5, 100)
Abstract Interpretation
Abstract interpretation is a technique in which the computations of a program are evaluated on abstract objects, with the goal of deriving results without executing the program. This is typically implemented by translating source code to a model instead of an executable program. This model is then examined for patterns that reveal potential errors. Abstract interpretation abstracts from the explicit value of a variable, and instead considers all the possible values it can have mapped to some abstract domain.
Consider the following example:
if (obj == null) {
    obj = getObject();
}
obj.method();
One problem abstract interpretation may detect in this example is that the
obj variable may have the value null even after line
2. This would cause a null dereference in the final line, which results in an
error and potentially the termination of the program. A human programmer could
very well overlook this fact; they will likely assume the
getObject() method returns an actual object rather than a
null value. An abstract interpretation tool would detect that
null is one of the potential values of obj and flag a
warning.
Abstract interpretation works by considering the range of possible values a
variable can take and restricting this range based on statements in the program.
This means an abstract interpretation tool may be able to deduce that obj
can never take a null value. If one of the values it could take is
null, something iswrong with the program.
TQI Abstract Interpretation
Abstract interpretation tools result in violations. The compliance factor [3] is used to compute a score based on these violations.
The TQI Abstract Interpretation sub-metric [2] is defined as follows:
score = max(compliance_factor(abstract_interpretation_violations) * 2 - 100, 0)
Cyclomatic Complexity
Definition
Cyclomatic complexity [1] (also known as McCabe complexity) is a complexity metric for imperative methods. It is computed by representing the possible paths of execution of the program in a graph and computing its cyclomatic number (i.e., the number of regions in a planar embedding of the graph). The idea is that methods with a lot of conditional statement or loops are more complex. This means maintainability of the program is hurt, since it is hard to understand for new developers working on it. It also means testing the code properly is harder, since it is harder to reach a sufficient level of coverage.
Since the original definition of Cyclomatic Complexity is quite abstract, the definition used by TIOBE is loosely
The decision count plus one
The decision count is incremented for control flow statements that
introduce a branch in the code, e.g., selection statements
(if-statement), iteration statements
(while-statement) and exception handling
(try-catch-statement).
The Cyclomatic Complexity of a function (or method) is the number of decisions in the function's body plus one. So, the minimum cyclomatic complexity of a function definition is one.
The Cyclomatic Complexity of a file is the number of decisions of all function definitions in that file plus one. In other words, this is the sum of the cyclomatic complexities of all function definitions in the file, minus the number of function definitions, plus one.
The Average Cyclomatic Complexity is the cyclomatic complexity per function of a file. So, this is the sum of the cyclomatic complexities of all function definitions, divided by the number of function definitions in the file.
Aggregation
The Average Cyclomatic Complexity is aggregated over multiple files as follows. Sum the cyclomatic complexities of all files, minus the number of files, divided by the total number of function definitions in these files combined, plus one.
TQI Cyclomatic Complexity
The TQI Cyclomatic Complexity sub-metric [2] is defined as follows:
score = 6400 / (cyclomatic_complexity^3 - cyclomatic_complexity^2 - cyclomatic_complexity + 65)
Cyclomatic Complexity Tool Comparison
There are a (great) number of free and commercial tools available that can be used to measure the (average) cyclomatic complexity of source files. Here, we will take a look at a few available options.
- CCCC
-
CCCC is an open source code counter for C, C++ and Java source files. It is reasonably cross-platform and can run on Windows and Linux. Unfortunately, its results are very unreliable. Moreover, it supports just a few programming languages.
- TICScyclox
-
TICScyclox is a TIOBE proprietary cyclomatic complexity measurement tool that supports a wide variety of programming languages (including JavaScript, Python, Objective-C and Scala). It runs on Windows, Linux and Solaris SPARC.
There are many more tools available to measure cyclomatic complexity. Some commercial, or part of a commercial package, some specific to a certain programming language. We will not discuss these here.
At TIOBE, we compared the results of CCCC, and TICScyclox on a great number of (customer) source files and found that TICScyclox produces better results than CCCC. These findings, together with its portability and support for a wide range of programming languages makes TICScyclox a logical default choice for our customers.
Cyclomatic Complexity and TICS
Configuration
Be sure to use a default configuration, or specify
TOOL: ['TICScyclox'] for your language in SERVER.yaml.
Running TICS
The metric to run with TICS for Average Cyclomatic Complexity is
AVGCYCLOMATICCOMPLEXITY.
To run the TICS client, use TICS -calc AVGCYCLOMATICCOMPLEXITY.
To run TICSQServer, use TICSQServer -calc AVGCYCLOMATICCOMPLEXITY.
Investigating High Cyclomatic Complexity in the TICS viewer
To quickly see "bad" files (wrt cyclomatic complexity) in TICS viewer, one can use the treemap and select the Average Cyclomatic Complexity as the color and Total Cyclomatic Complexity for the area metric.
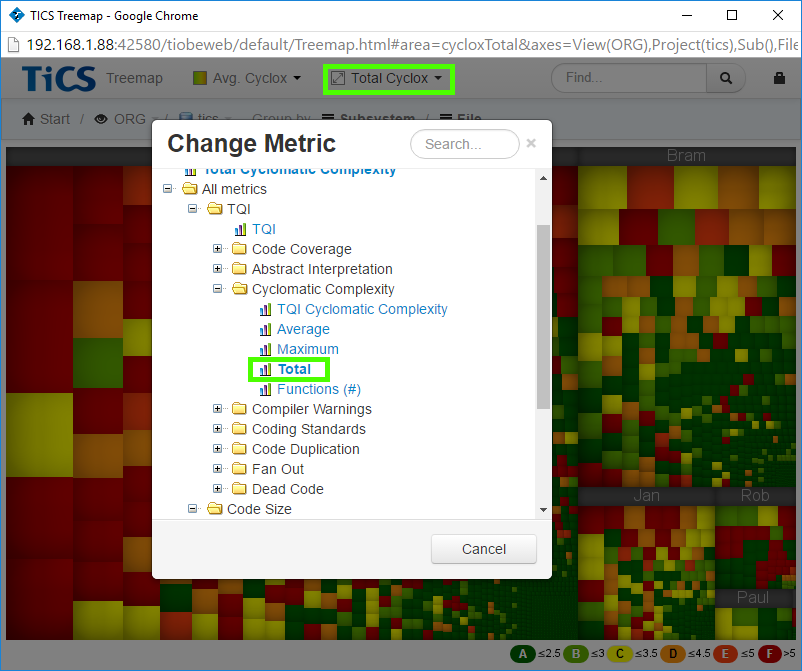
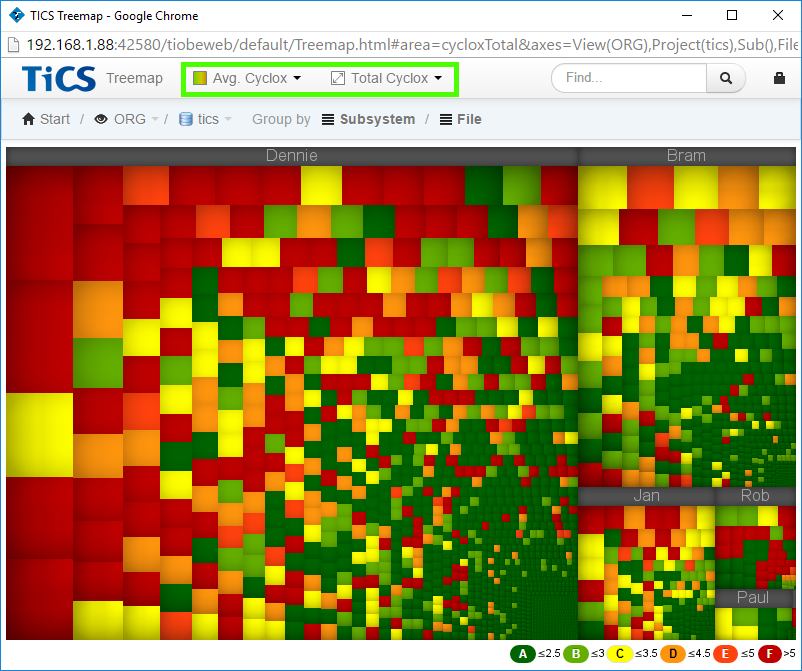
The big, dark red files are the ones to go after first.
Compiler Warnings
Compiler warnings are potential errors in the source code that are discovered during compilation. These include syntactic errors for which the semantics are easily misinterpreted, portability issues and type errors. They can therefore be seen as a metric for the quantity and impact of potential bugs.
Consider the following example:
if (var = 0) {
    var++;
}
Most languages use the = operator for assignment and expect a boolean
condition, e.g., var == 0. Note that in this case, var = 0
is not a boolean expression for the equality of var and 0,
but an assignment of 0 to var. This
assignment is executed, followed by the execution of the code in the body. A
compiler will recognize that this is likely unintended and warns the programmer.
Other warnings could relate to arithmetic operations that are inconsistent
across systems with different bitness. This hurts the portability of the code.
TQI Compiler Warnings
The compliance factor [3] is used to compute a score based on compiler warnings.
The TQI Compiler Warnings sub-metric [2] is defined as follows:
score = max(100 - 50 * log10(101 - compliance_factor(compiler_warnings)), 0)
Coding Standards
Coding standards provide rules for software developers to follow while writing code. The most important reason for coding standards is maintainability; a clear set of rules makes it easier for programmers to understand the meaning of code. A subset of coding standards can be used as predictor for finding fault- related lines of code.
Examples of coding standards include naming conventions (e.g., using lower
case for variable names and capitals for class names), rules for indentation (e.g.,
use of spaces instead of tabs, indenting the body following an if-statement) and
the exclusion of language features (e.g., disallowing use of goto statements).
To measure adherence to coding standard automatically, rules can be pro- grammed into a tool that automatically identifies violations of the standard. This requires rules to be sufficiently precise. A meaningful metric for adherence to coding standard depends on the quality of the coding standard and a suitable classification of the weight of each of its rules.
TQI Coding Standards
The compliance factor [3] is used to compute a score based on coding standard violations.
The TQI Coding Standards sub-metric [2] is defined as follows:
score = compliance_factor(coding_standard_violations)
Code Duplication
Code Duplication is a software metric that indicates the amount of source code that occurs more than once in a program. Code Duplication is undesirable because it is associated with higher maintenance costs and can be indicative of bad design.
A duplication is a consecutive string of source code tokens (code fragment) that is similar to another code fragment, possibly inside the same file. A code fragment might be part of more than one duplication. TICS uses the CPD tool to detect code duplication. At least 100 tokens should be logically identical to qualify as code duplication.
The TICS Viewer defines the following basic metrics related to Code Duplication:
- Code Duplication (%)
- The number of tokens that are duplicated as a percentage of the total number of tokens in the file.
- Code Duplication (# tokens)
- The number of tokens that are part of a duplication.
- Code Duplication Metric Coverage
- The percentage of lines of code that could be analyzed by the code duplication tool, ideally 100%.
- TQI Code Duplication
- The TQI score for Code Duplication is a value between 0% and 100% that,
when using the latest TQI definition,
is obtained using the following formula:
score = min(-40 * log10(Code Duplication (%)) + 80, 100) * Code Duplication Metric Coverage
Remarks
- TiCS runs CPD on a single project and does not detect duplications over different projects.
- Before TQI version 4.7, duplications were measured in terms of lines, not tokens. This has been changed in 4.7 to address certain unexpected results.
Scope-related Code Duplication
Scope-related Code Duplication metrics allow you to filter the duplications based on where the source and target fragment of a duplication are located:
- File-Internal Code Duplication
- The source and target fragments are located in the same file.
- File-External Code Duplication
- The source and target fragments are located in different files.
- Scope-Internal Code Duplication
- The source and target files are in the same selected scope.
- Scope-External Code Duplication
- The target file is outside of the selected scope.
Each of the four types has a relative (%) and an absolute (# tokens) variant. The scope-based metrics require a scope that is chosen by the user and can be a directory, component, or other subsystem. The scope is indicated in the breadcrumb trail as ' Scope'; all items before it form the scope. You can move the scope to a different place using drag & drop.
Using these advanced metrics, users can filter duplications by the type that they are interested it. For instance, file-internal duplication could be considered easier to solve because they are located in the same file. On the other hand, file-external duplications might be harder to keep track of by developers and one might want to solve them first. The scope-internal metric can be useful for developers to limit the duplications they see to the component for which they are responsible or are allowed to make changes to.
Custom Code Duplication
It is possible to configure the duplication detector to use a different minimum number of tokens that qualify as a duplication than the default of 100 that is used by the TQI definition, Configure a higher threshold will result in less duplications, whereas setting a lower value will result in more. When you have configured a custom token count in TICS and after you have performed an analysis, the Custom Code Duplication related metrics will be shown in the metric picker.
To use this feature, you have to enable the TICS metric DUPLICATEDCODECUSTOM
as explained here.
This metric is separate from the DUPLICATEDCODE metric and will not affect the TQI version.
Fan Out
Software programs are structured in terms of modules or components. These modules and components "use" each other. The fan out metric indicates how many different modules are used by a certain module. If modules need a lot of other modules to function correctly (high fan out), there is a high interdependency between modules, which makes code less modifiable. Hence, fan out is related to the "Maintainability" ISO attribute.
Furthermore, there is a difference between the usage of external and internal imports. External imports concern imports from outside the software system (for instance standard libraries) while internal imports concern references within the code base itself. External imports are a method of reusing software and as such are considered to be less harmful to the quality of the software system.
Fan Out split by internal and external imports
In the case that an internal/external import split is supported by the TICS integration of the language, fan out is measured by counting the number of imports, whether external or internal, per module, and taking a weighted average where internal imports count for 4 times the negative impact of external imports. The specific measurement is language dependent. Currently, split fan-out is supported for C, C++, C# and Java.
Unclassified Fan Out
In the case that it is difficult or impossible to discern from an import statement whether it is external or internal fan-out, no difference is made between the different types of fan-out. Instead, fan-out is treated as a single metric, of which the value is equal to the number of import statements. If split fan-out is not supported, then unclassified fan-out is used.
C/C++
For C and C++ the number of include directives is
used. The split is made dependent on whether a standard include or a user
include is used; standard includes are counted as external fan-out whereas
user includes are counted as internal fan-out.
C#
The situation is even more complex for C# because it uses a
different import mechanism. The using statement in
C# imports a complete namespace, which could consist of hundreds
of classes, whereas only a few of these are actually used. That is why for
C# the actual number of unique dependencies per file is counted.
If an import comes from a namespace associated with the software system, then
it is counted as internal fan-out; else, it is counted as external fan-out.
Java
For Java, the number of import statements is
counted. Wildcards in Java import statements appear to be difficult because
these statements import several classes from a package at once. That is why we
choose to count these statements as 5.
If an import comes from a package associated with the software system, then
it is counted as internal fan-out; else, it is counted as external fan-out.
JavaScript
For EcmaScript 6, the number of import statements is counted.
Therefore, each module mentioned in the from clause counts as
1 irrespective of the number of elements imported. E.g.,
import localName from 'src/my_lib';
import * as my_lib from 'src/my_lib';
import { name1, name2 } from 'src/my_lib';
all count as 1 since each statement imports one module.
Python
For Python, the number of modules mentioned in the
import statement are counted.
from-import counts as 1.
Swift
For Swift, the number of modules mentioned in import
declarations is counted.
Average Fan Out
The average Fan Out of a software system is a weighted average of the count of internal imports and the count of external imports in the case the difference between internal and external fan-out is supported for the language, and the number of imports in the case unclassified fan-out is used. These are then aggregated by summing the fan out values of all files, and divided by the number of files.
TQI Fan Out (unclassified fan-out)
score = min(max(120 - 5 * unclassified_fan_out, 0), 100)
TQI Fan Out (split by internal and external)
score = min(max(120 - (8 * internal fan_out + 2 * external fan_out), 0), 100)
Security
Security focuses on identifying security vulnerabilities in software implementations. When software applications are not designed to consider security aspects, such as confidentiality, integrity, and availability, the software might be vulnerable to exploitation [4]. Vulnerabilities can exist from a security flaw, a human error in software, which can originate at any point in a software development cycle [7]. TICS uses code checkers with a set of security rules to check for security vulnerabilities.
One common example of a defect that can result in a vulnerability is using components with known vulnerabilities [5].
This can range from using deprecated modules/libraries to using unsafe functions like
strcpy() in C [6]. The strcpy() function is known to be unsafe against buffer overflow vulnerabilities, leading to a potential security exploit within your software.
Unsafe functions like these can be automatically detected code checkers and reported by TICS, and more in-depth checks like injections.
One important thing to note that static security checking is still in its infancy, and it is recommended to have a parallel code quality check that includes the TQI as well as other metrics covered by the ISO 25010 [8] standard.
TQI Security
The compliance factor [3] is used to compute a score based on security violations. The TQI Security sub-metric [2] is defined as follows:score = compliance_factor(security_violations)
Dead Code
Dead code is code that does not serve any purpose. As such, it hurts the maintainability of software.
Measuring dead code is restricted to unused files and methods. Dead code is measured in terms of LOC. This means that an unreachable method or file is counted more heavily when it is larger.
Dead Code Suppression
It is possible to suppress C/CPP dead code violations as reported by CppCheck using TICS's
violation suppression mechanism.
Suppressing such violations can be done by using special comments in the code. These
special comments start with "//TICS" or "/*TICS". A single space between
the comment marker and the TICS keyword is allowed, e.g. "// TICS" or "/* TICS".
After the preceding "//TICS" or "/*TICS" one can specify
the ruleid "-DEADCODE".
This mechanism can be used to suppress functions triggered by hardware. To give some examples:
//TICS -DEADCODE: HW triggered function
The following example shows how this mechanism can be used in practice for suppression of dead code on one or more functions. The first comment turns suppression on, while the second comment turns the suppression off again. So functionA is not counted as dead code, while functionB is again counted as dead code in case it is not reachable.
//TICS -DEADCODE: HW triggered function
void functionA {...}
//TICS +DEADCODE: HW triggered function

void functionB {...}
//TICS !DEADCODE: HW triggered function
The following example shows how this mechanism can be used in practice for suppression of dead code on one specific function. The TICS !DEADCODE comment turns off dead code for functionC.
void functionC // TICS !DEADCODE: HW triggered function
{...}
TQI Dead Code
The TQI Dead Code sub-metric [2] is defined as follows:
score = max((100 - 2 * dead_code), 0)
Lines Of Code
Lines Of Code (LOC) counts the physical lines in each source file, including comment lines and blank lines, but excluding generated lines. Generated lines of code are those regions in source files that are automatically generated by development environments and are outside the control of software developers. TICS ships with a default set of recognized markers for generated code for commonly used development environments. See the section on GENERATED code for languages in SERVER.yaml.
Lines Of Code is the primary measurement of code size used by TICS. All measurements are related to LOC for comparison. E.g., for the compliance factor violations are weighed by LOC. For treemaps, LOC is the default area metric.
Effective Lines Of Code
Effective Lines Of Code (ELOC) counts the physical lines in each source file, excluding comment lines and blank lines, and excluding generated lines.
Effective Lines Of Code is a measure of actual code size; those lines that are not affected by formatting and style conventions but are necessary for the required functionality of the program being written.
Effective Lines Of Code is a subset of Lines Of Code.
Generated lines included Lines Of Code
Generated lines included Lines Of Code (GLOC) counts the physical lines in each source file, including comment lines and blank lines, and including generated lines.
GLOC indicates the absolute amount of code of the application. This metric is not used as a submetric for any other (aggregated) measurement.
GLOC is a superset of LOC. The difference between LOC and GLOC gives the number of generated lines of code in the code.
NPath Complexity
Definition
NPath Complexity (PATHCOUNT) [9], or, Noncyclic Execution Paths, or, Static Path Count, is a measure of execution path complexity.
NPath counts the acyclic execution paths through a function. It is an objective measure of software complexity related to the ease with which software can be comprehensively tested.
Here, we will define NPath complexity via the following recurrence relation.
Note, that the structural induction is based on languages with a C-like
syntax (e.g., C, C++, C#, Java). But, this definition can be generalized for
any language that supports selection statements (if,
switch), iteration statements (while,
for) and sequential statement catenation.
NPC({ S1 }) = NPC(S1)  // block statement
NPC(S1; S2) = NPC(S1) * NPC(S2)  // sequential statements
NPC(if (E1) S1 else S2) = NPC(E1) + NPC(S1) + NPC(S2)  // if statement: in case of no else, NPC(S2) = 1
NPC(switch (C1) { case E1: S1; case E2: S2; ... case En; Sn; }) = SUM(i = 1..n | NPC(Si))  // switch statement
NPC(while (E1) S1) = 1 + NPC(E1) + NPC(S1)  // while statement
NPC(do S1 while (E1)) = 1 + NPC(E1) + NPC(S1)  // do-while statement
NPC(for(E1; E2; E3) S1) = 1 + NPC(E1) + NPC(E2) + NPC(E3) + NPC(S1)  // for statement
NPC(S1) = 1  // any other statement; not one of the above
Additionally, for those tools that support it, the following hold for expressions.
NPC(E1 && E2) = 1 + NPC(E1) + NPC(E2)  // logical AND
NPC(E1 || E2) = 1 + NPC(E1) + NPC(E2)  // logical OR
NPC(E1 ? E2 : E3) = 2 + NPC(E1) + NPC(E2) + NPC(E3)  // conditional operator
NPC(E1) = 0  // any other expression; not one of the above
TICS also computes:
- PATHCOUNT_MAX: the maximum PATHCOUNT in a file
- NPath Complexity/Function: the average PATHCOUNT per function in a file
NPath Complexity Tool Comparison
- TICSc
-
TICSc is a TIOBE proprietary metric measurement tool for C. TICSc supports the full definition above.
- Coverity
-
The PATHCOUNT for this integration is based on
Coverity's"Acyclic Path Count", which is defined in [10] as:Acyclic Path Count
The number of execution paths in a function, with loops counted one time at most. The following assumptions are also made:
continuebreaks out of a loop.whileandforloops are executed exactly 0 or 1 time.do…whileloops are executed exactly once.gotostatements which go to an earlier source location are treated as an exit.
Prerequisites
For a successful
CoverityPATH_COUNT integration, the following prerequisites must be met:- The location of Coverity should be configured via INSTALLDIR or added to the PATH.
- The
CoverityBUILDCOMMAND should also be configured to support local analysis. See here how to set a Coverity BUILDCOMMAND property. - If fetching results from coverity connect is desired,
CoverityWEBSERVICE should also be configured
Note: The recommended TICS -
CoverityPATH_COUNT integration is to configure BUILDCOMMAND and let local analysis results be available for TICS. Furthermore, this is only supported for TICSQServer.
NPath Complexity and TICS
Configuration
To enable NPath Complexity, set the following in the 'METRICS' section of your SERVER.yaml (so it is globally enabled), or PROJECTS.yaml (to enable it per project).
PATHCOUNT:
  ENABLED: 1
PATHCOUNT_MAX:
  ENABLED: 1
For C, TICSc is used to measure NPath Complexity. For
C#, JavaScript, and TypeScript,
Coverity is used. Other languages are currently not yet
supported.
Specify
TOOL: 'TICSc',
or
TOOL: 'Coverity',
for your language in
SERVER.yaml.
Example:
LANGUAGES;
  C:
    PATHCOUNT:
      TOOL: 'TICSc'
    PATHCOUNT_MAX:
      TOOL: 'TICSc'
  CS:
    PATHCOUNT:
      TOOL: 'Coverity'
    PATHCOUNT_MAX:
      TOOL: 'Coverity'
Change Metrics
Change metrics (also known as Churn metrics) measure the amount of changes in the project. These changes can give insight into how actively a project is developed, which components are changed most often and which parts are being added and/or removed.
Change Rate
The change rate metric measures the amount of changes that were made since the previous measurement. This change is expressed in terms of lines of code.
The change rate includes code that has been added, deleted or changed. These metrics are stored separately. Their sum is the total change rate.
Accumulative Change Rate
In addition to change rate, TICS also stores accumulative change rate. This metric refers to not just the changes that were made since the last measurement, but all of the changes that have been recorded historically.
Other change metrics
The following metrics are also available:
- Date Modified
- The last time a file was changed.
- Changed Files (#)
- The number of added and changed files.
- Changed, non-New Files (#)
- The number of changed files, excluding added files.
- New Files (#)
- The number of new files.
- Deleted Files (#)
- The number of deleted files.
References
- T. J. McCabe Sr., "A complexity measure," IEEE Trans. Software Eng., vol. 2, no. 4, pp. 308-320, 1976.
- P. Jansen. (2012). The TIOBE Quality Indicator: A pragmatic way of measuring code quality, [Online]. Available: https://www.tiobe.com/files/TIOBEQualityIndicator.pdf.
- P. Jansen, R. L. Krikhaar, and F. Dijkstra. (2007). Towards a single software quality metric, [Online]. Available: https://www.tiobe.com/files/DefinitionOfConfidenceFactor.pdf.
- The OWASP Foundation, "OWASP Secure Coding Practices Quick Reference Guide", [Online]. Available: https://owasp.org/www-pdf-archive/OWASP_SCP_Quick_Reference_Guide_v2.pdf.
- OWASP Top Ten 2017, [Online]. Available: https://owasp.org/www-project-top-ten/2017/.
- Common Weakness Enumeration, CWE-676, [Online]. Available: https://cwe.mitre.org/data/definitions/676.html.
- Robert C. Seacord, "Secure Coding in C and C++", 2006 Carnegie Mellon University.
- ISO/IEC 25010:2011, 2011, "Systems and software engineering - Systems and software Quality Requirements and Evaluation (SquaRE) - System and software quality models". Available: https://www.iso.org/standard/35733.html.
- "NPATH: a measure of execution path complexity and its applications." The Free Library. 1988 Association for Computing Machinery, Inc. [Online]. Available: https://www.thefreelibrary.com/NPATH%3a+a+measure+of+execution+path+complexity+and+its+applications.-a06242192.
- "Coverity 2021.03 Checker Reference." Synopsys, Inc